小程序使用antV-f2组件

在小程序开发的过程中,需要一个图表插件。搜索了各个插件以后,感觉 antV 比较美观,于是决定使用 antV。
但是在使用的过程中,一步一步按照 antV 的文档来开发,并不能实现想要的功能。搜索各方解决方案以后,感觉或多或少都有些问题出现。
以下代码为我的 demo 成品,其实也并不复杂。使用前请先自行安装 antV-f2.
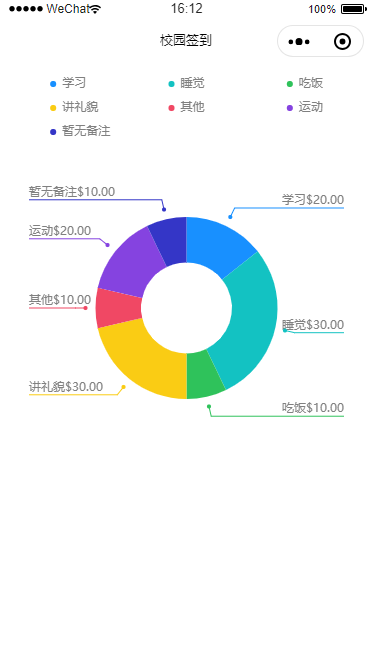
成品图

wxml

1
2
3
<view class="container">
<ff-canvas id="column-dom" canvas-id="column" opts="{{ opts }}"></ff-canvas>
</view>

wxss

1
2
3
4
5
6
7
8
9
10
11
12
13
14
.container {
width: 100%;
height: 800rpx;
display: flex;
flex-direction: column;
align-items: center;
justify-content: space-between;
box-sizing: border-box;
padding: 0;
}
#column-dom {
height: 100%;
width: 100%;
}

js

1
2
3
4
5
6
7
8
9
10
11
12
13
14
15
16
17
18
19
20
21
22
23
24
25
26
27
28
29
30
31
32
33
34
35
36
37
38
39
40
41
42
43
44
45
46
47
48
49
50
51
52
53
54
55
56
57
58
59
60
61
62
63
64
65
66
67
68
69
70
71
72
73
74
75
76
77
78
79
80
81
82
83
84
85
86
87
88
89
90
91
92
93
94
95
96
97
98
99
100
101
102
103
104
105
106
107
108
109
110
111
// import F2 from '@antv/wx-f2'; // 注:也可以不引入, initChart 方法已经将 F2 传入,如果需要引入,注意需要安装 @antv/wx-f2 依赖
let chart = null

function initChart(canvas, width, height, F2) {
const data = [{
amount: 20,
ratio: 0.1,
memo: '学习',
const: 'const'
}, {
amount: 30,
ratio: 0.2,
memo: '睡觉',
const: 'const'
}, {
amount: 10,
ratio: 0.05,
memo: '吃饭',
const: 'const'
}, {
amount: 30,
ratio: 0.15,
memo: '讲礼貌',
const: 'const'
}, {
amount: 10,
ratio: 0.05,
memo: '其他',
const: 'const'
}, {
amount: 20,
ratio: 0.1,
memo: '运动',
const: 'const'
}, {
amount: 10,
ratio: 0.05,
memo: '暂无备注',
const: 'const'
}];
chart = new F2.Chart({
el: canvas,
width,
height
});

chart.source(data);
chart.coord('polar', {
transposed: true,
innerRadius: 0.5,
radius: 0.65
});
chart.axis(false);
chart.legend({
position: 'top',
align: 'center'
});
chart.tooltip(false);

// 配置文本饼图
chart.pieLabel({
sidePadding: 30,
inflectionOffset:20,
adjustOffset:30,
anchorOffset:10,
skipOverlapLabels:true,
// activeShape:true,
label1: function label1(data) {
return {
text: data.memo + '$' + data.amount.toFixed(2),
fill: '#808080'
};
},
// label2: function label2(data) {
// return {
// fill: '#000000',
// text: '$' + data.amount.toFixed(2),
// fontWeight: 500,
// fontSize: 10
// };
// }
});
//图表中间部分的文字,小程序或许不支持
// chart.guide().html({
// position: ['50%', '45%'],
// html: `<view style="width: 250px;height: 40px;text-align: center;">
// <view style="font-size: 16px">总资产</view>
// <view style="font-size: 24px">133.08 亿</view>
// </view>`
// });

chart.interval()
.position('const*ratio')
.color('memo', ['#1890FF', '#13C2C2', '#2FC25B', '#FACC14', '#F04864', '#8543E0', '#3436C7', '#223273'])
.adjust('stack');
chart.render();
chart.get('canvas').draw();
return chart;
}

Page({

/**
* 页面的初始数据
*/
data: {
opts: {
onInit: initChart
}
}
})